Direct traffic grew. Real visitors didn't.
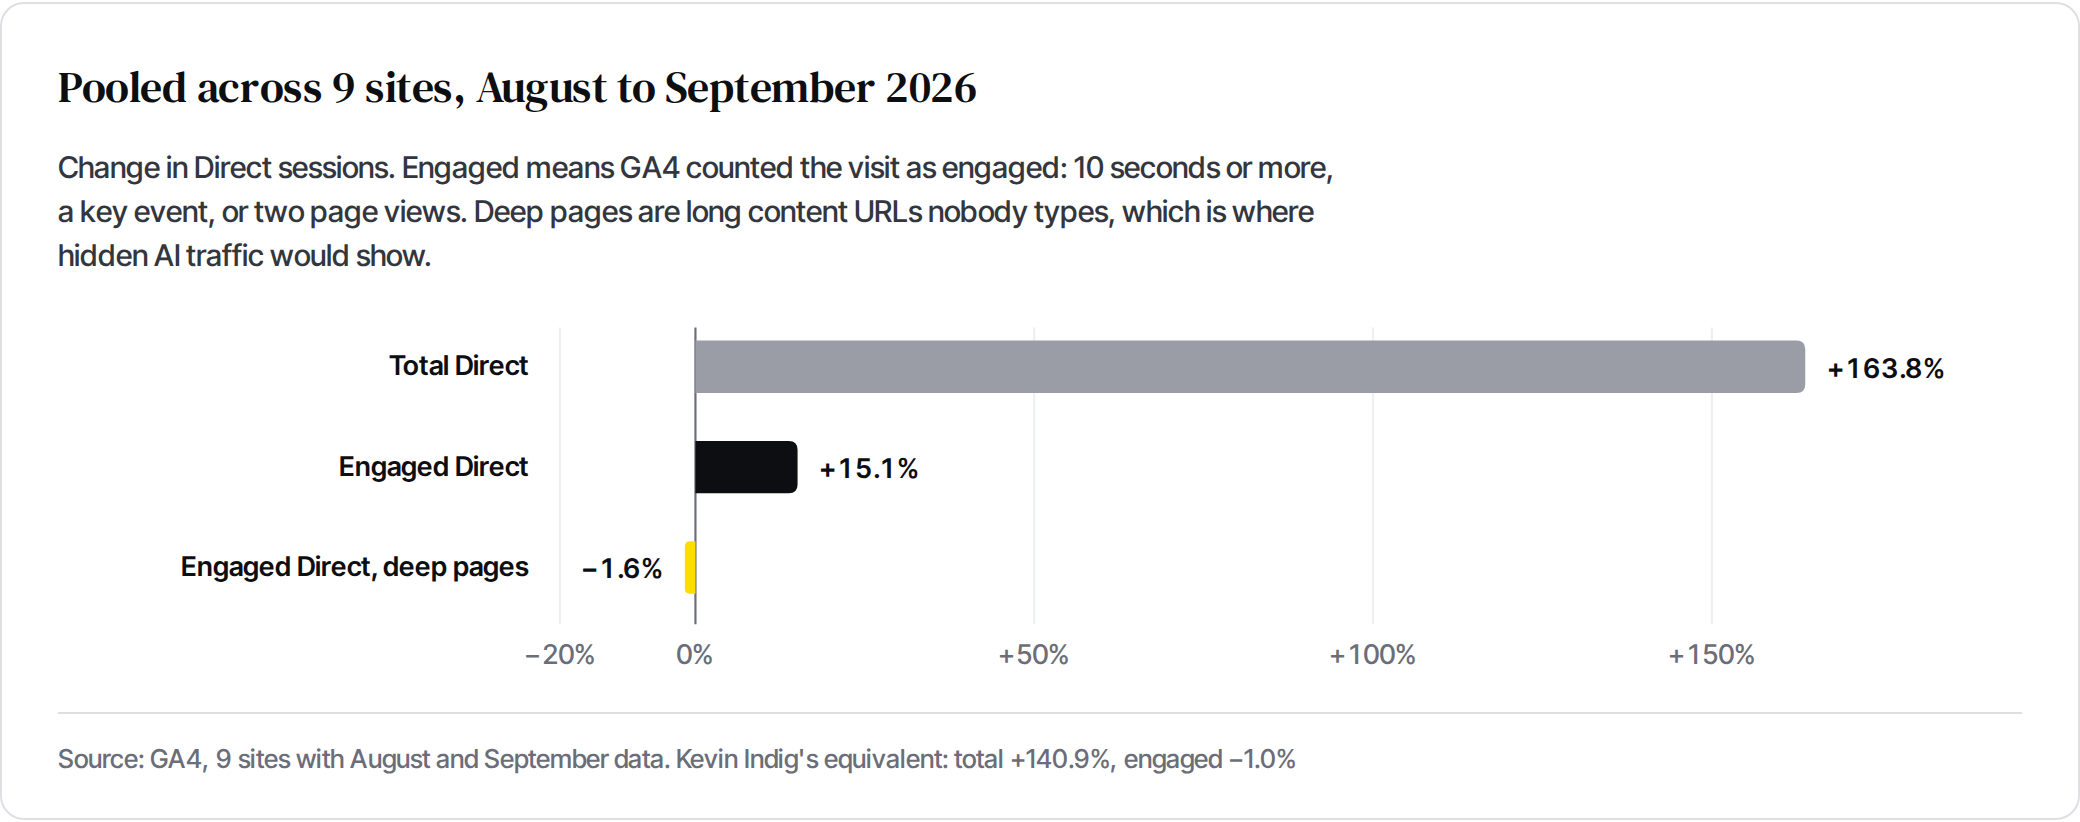
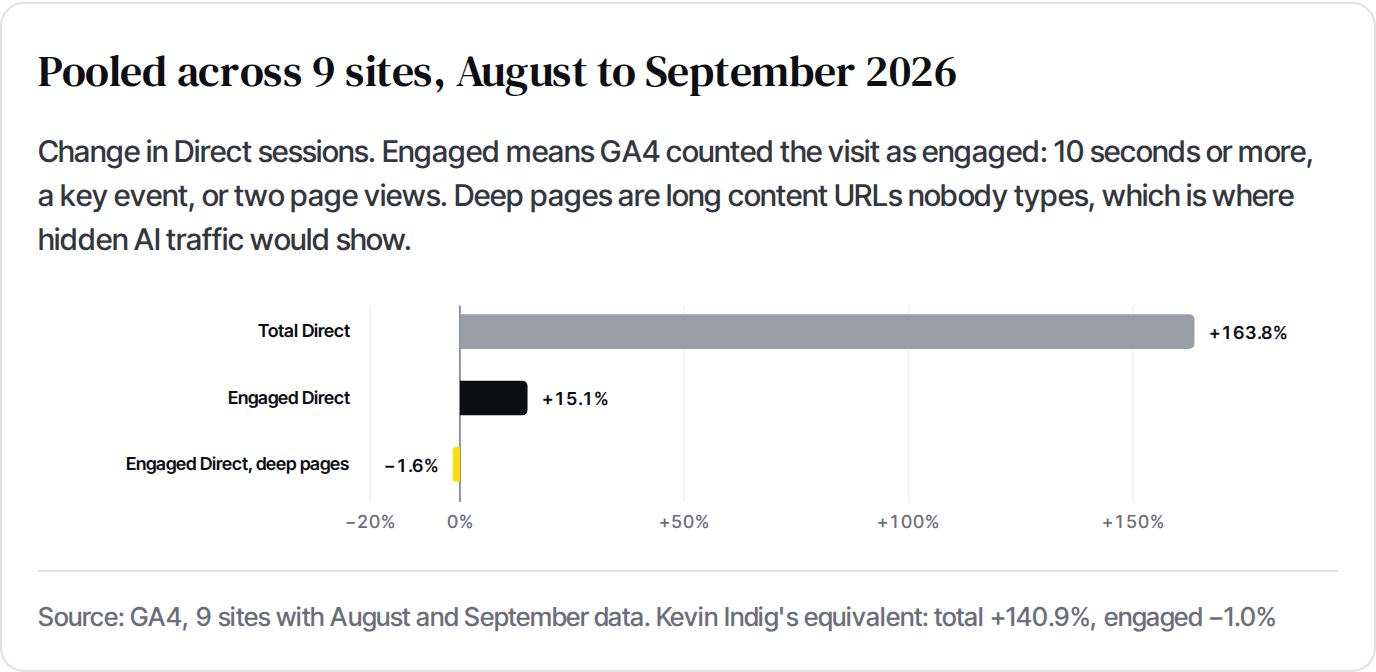
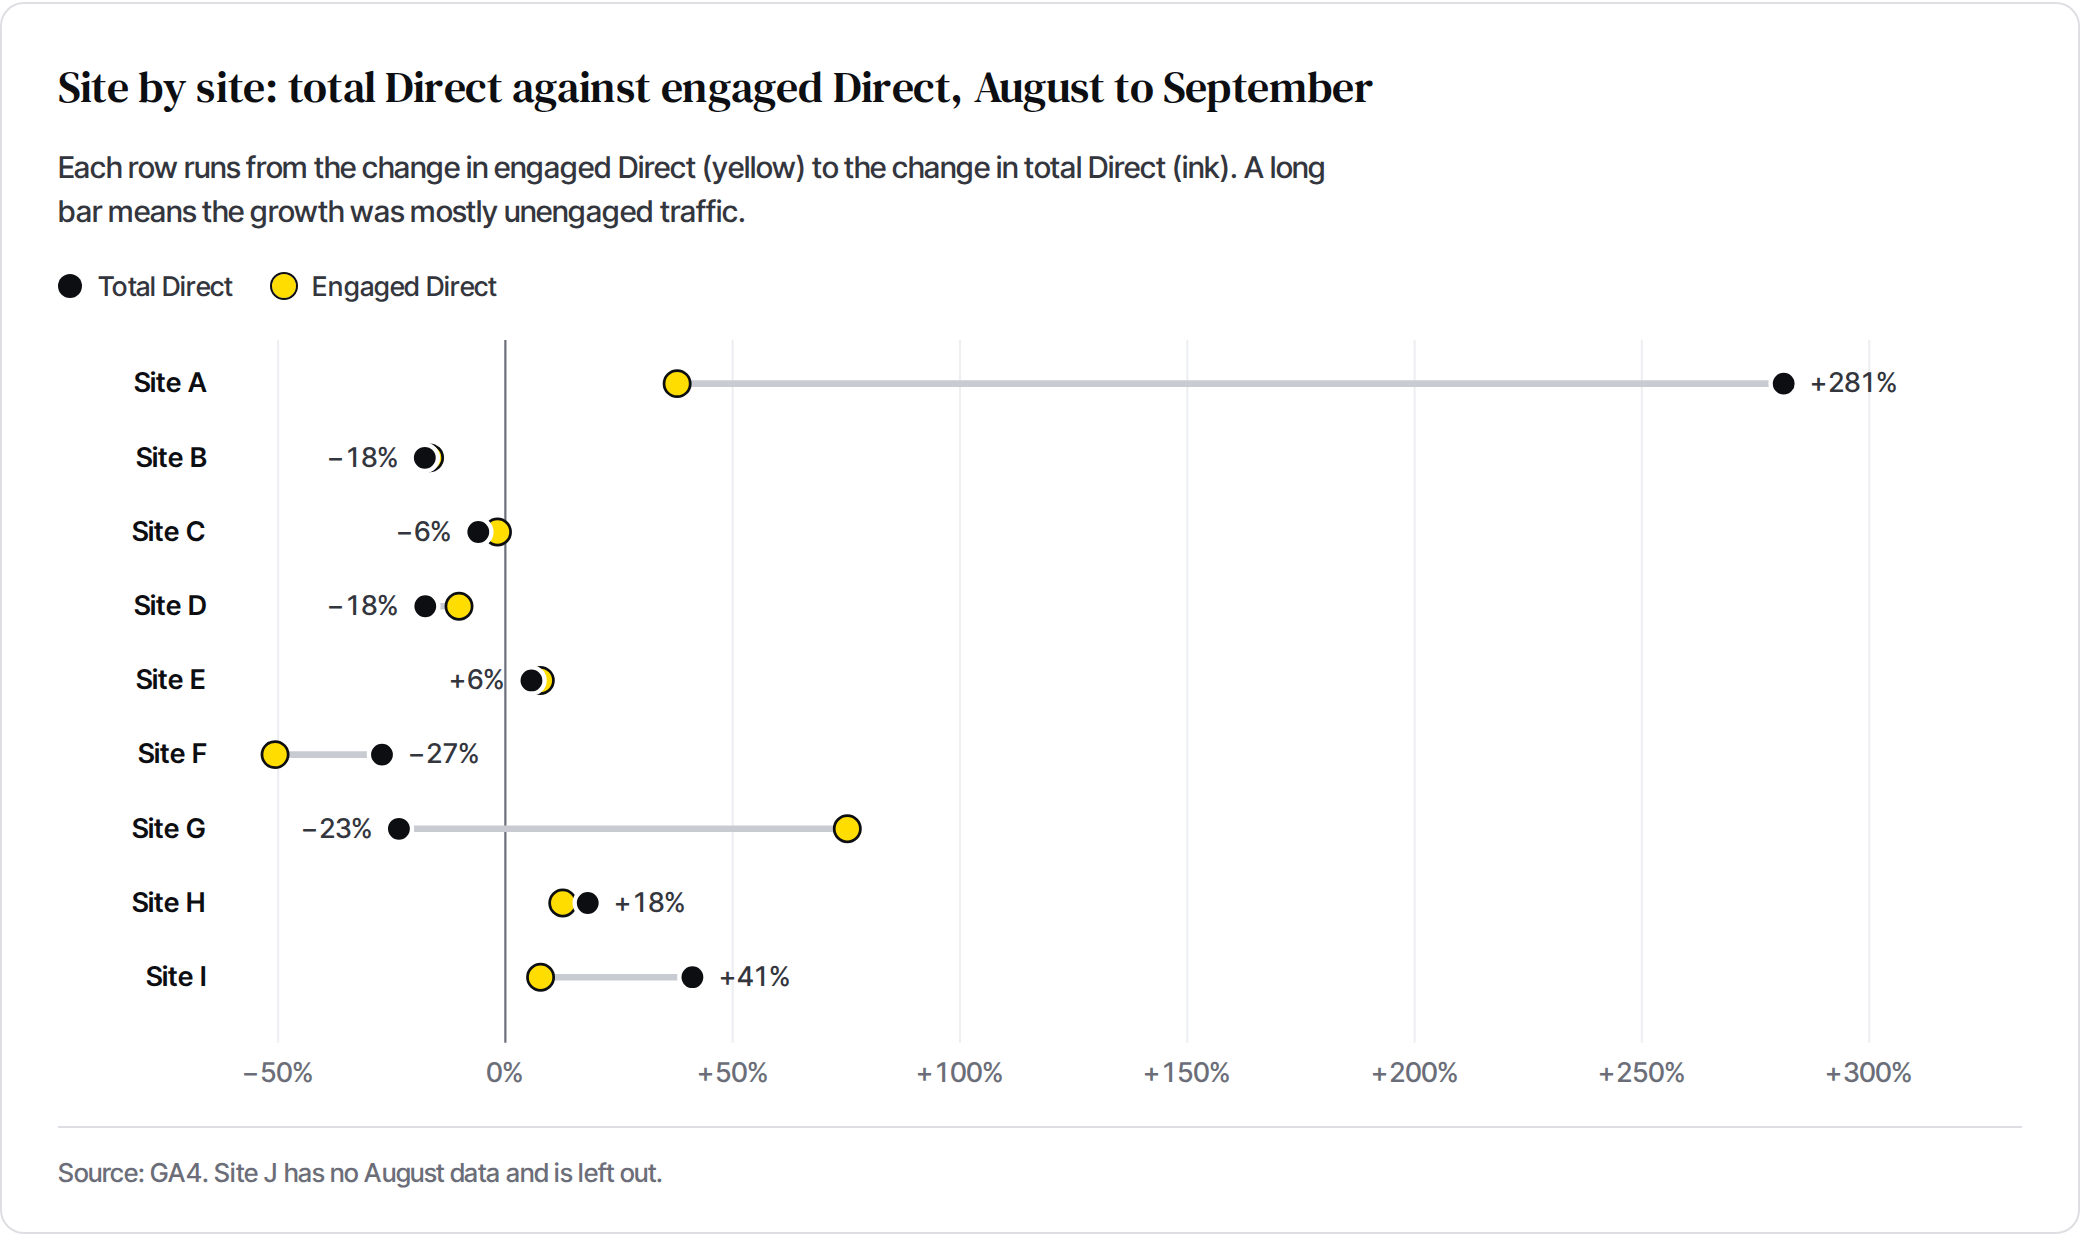
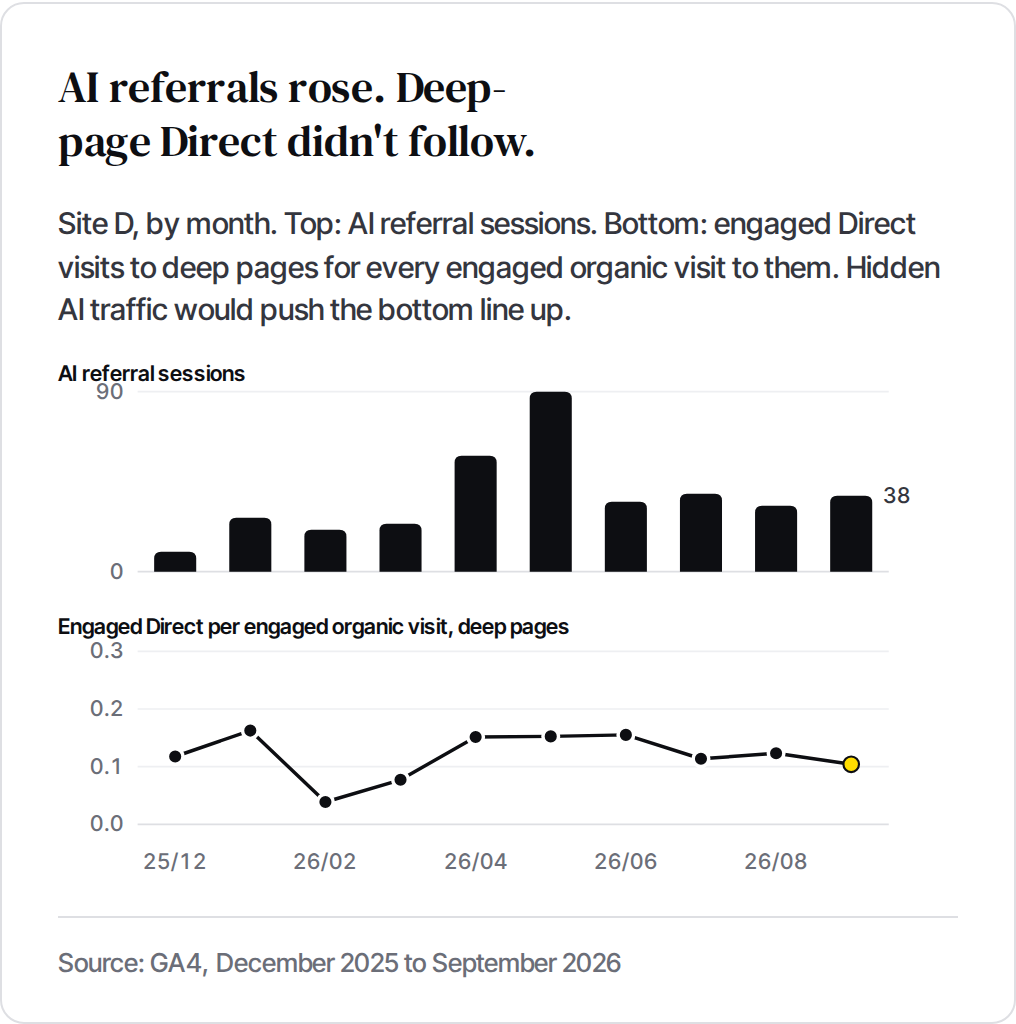
Across the 9 sites with August and September data, Direct sessions rose from 32,147 to 84,797, a +164% jump. Engaged Direct rose +15%. Engaged Direct visits to deep content pages, where hidden AI traffic should land, went from 448 to 441.
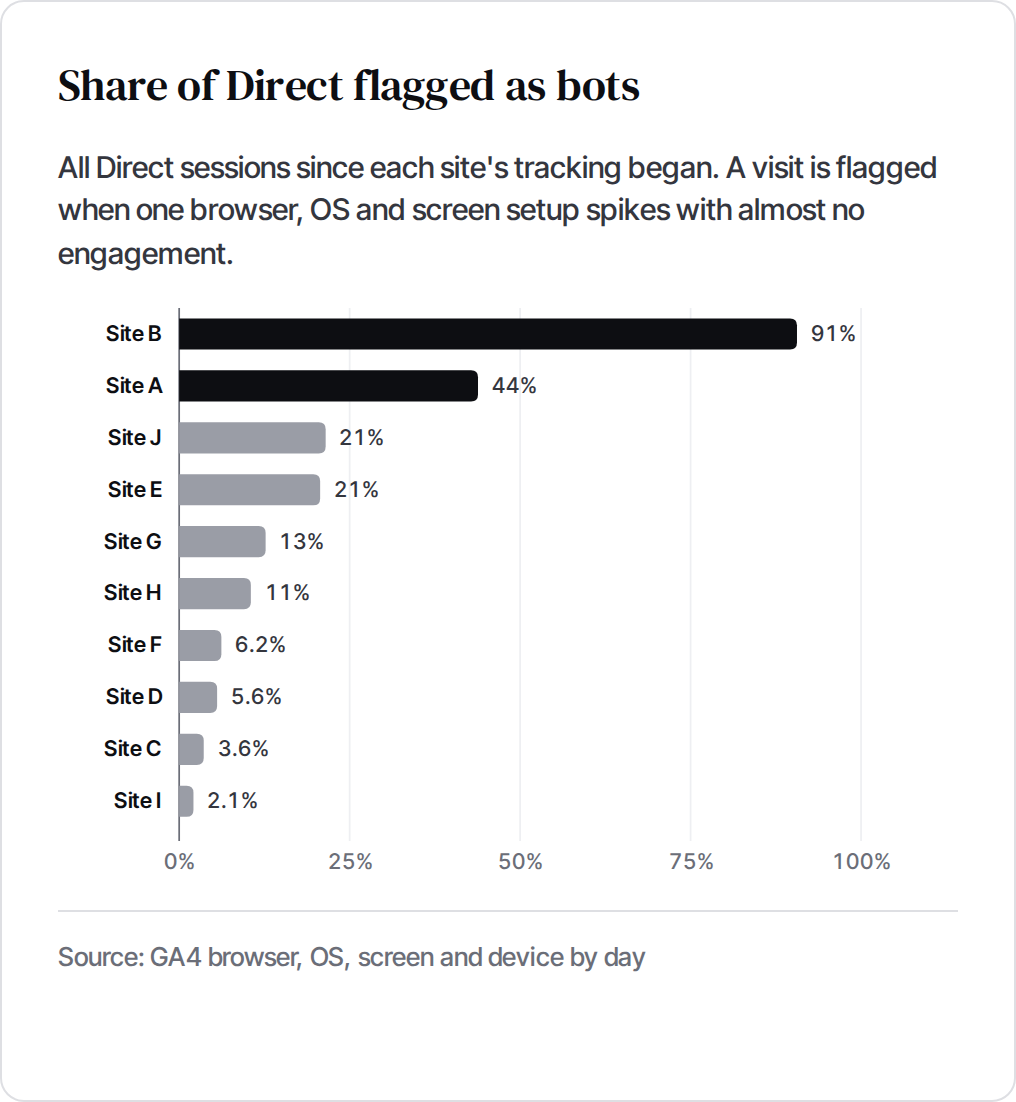
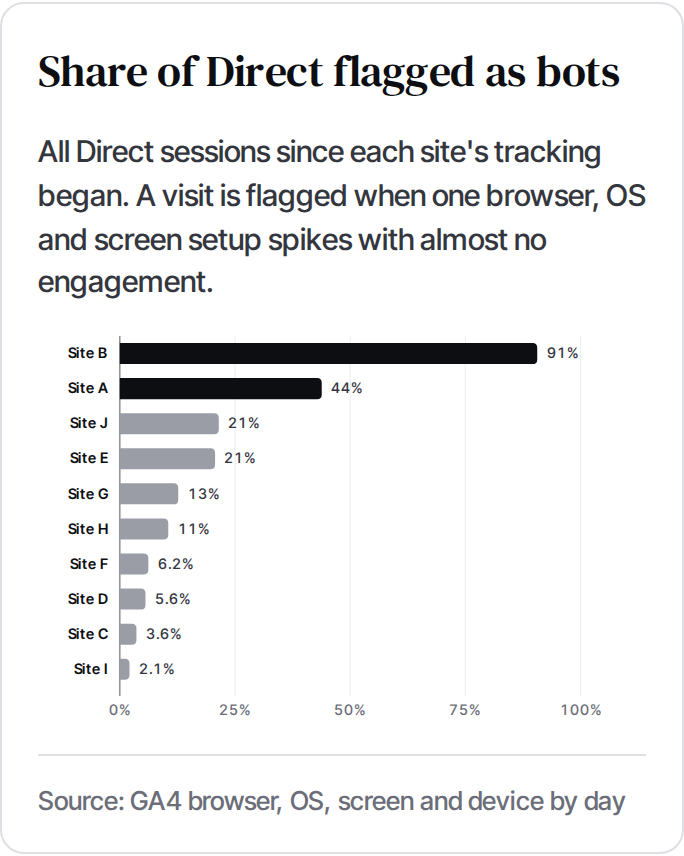
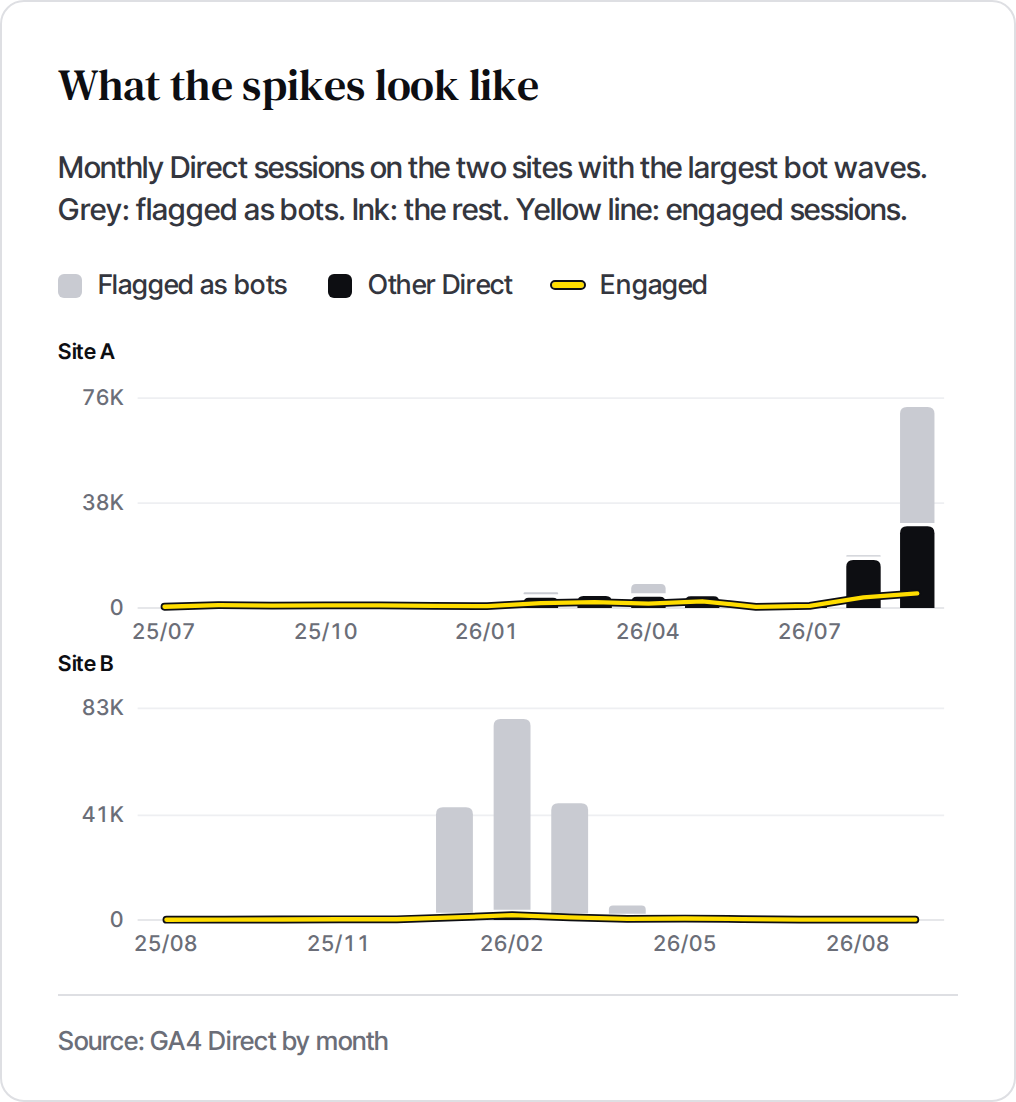
Almost all of the jump came from one site. Site A's Direct went from 19,106 to 72,830 in a month, mostly iPhone Safari sessions with a fixed 998-pixel screen height, varying widths and almost no engagement. Site B had an earlier wave: 153,614 sessions from one Chrome on Windows setup at 3840 × 2160, 94% of them from China, landing on help articles between January and April.
Only 4 of 9 sites grew Direct at all. Kevin saw 8 of 12. September isn't a universal AI month; it's whatever the bots did that month.
Show the table
| Site | Direct Aug | Direct Sep | Total change | Engaged change | Deep engaged Aug | Deep engaged Sep |
|---|---|---|---|---|---|---|
| Site A | 19,106 | 72,830 | +281.2% | +37.8% | 13 | 49 |
| Site B | 316 | 260 | −17.7% | −16.7% | 6 | 4 |
| Site C | 7,441 | 6,998 | −6.0% | −1.7% | 230 | 209 |
| Site D | 2,038 | 1,679 | −17.6% | −10.2% | 110 | 91 |
| Site E | 122 | 129 | +5.7% | +7.7% | 8 | 8 |
| Site F | 899 | 655 | −27.1% | −50.7% | 61 | 42 |
| Site G | 1,230 | 942 | −23.4% | +75.2% | 10 | 30 |
| Site H | 436 | 515 | +18.1% | +12.6% | 0 | 0 |
| Site I | 559 | 789 | +41.1% | +7.7% | 10 | 8 |
Not one Direct visit carried an AI fingerprint
We searched all 489,920 Direct sessions for landing URLs carrying a ChatGPT, Perplexity, Gemini, Copilot or Claude source tag. ChatGPT now adds utm_source=chatgpt.com to many links, so a share of AI visits should arrive tagged even when the referrer is lost. We found none. When AI tools pass a tag, GA4 files the visit under the AI source, not Direct.
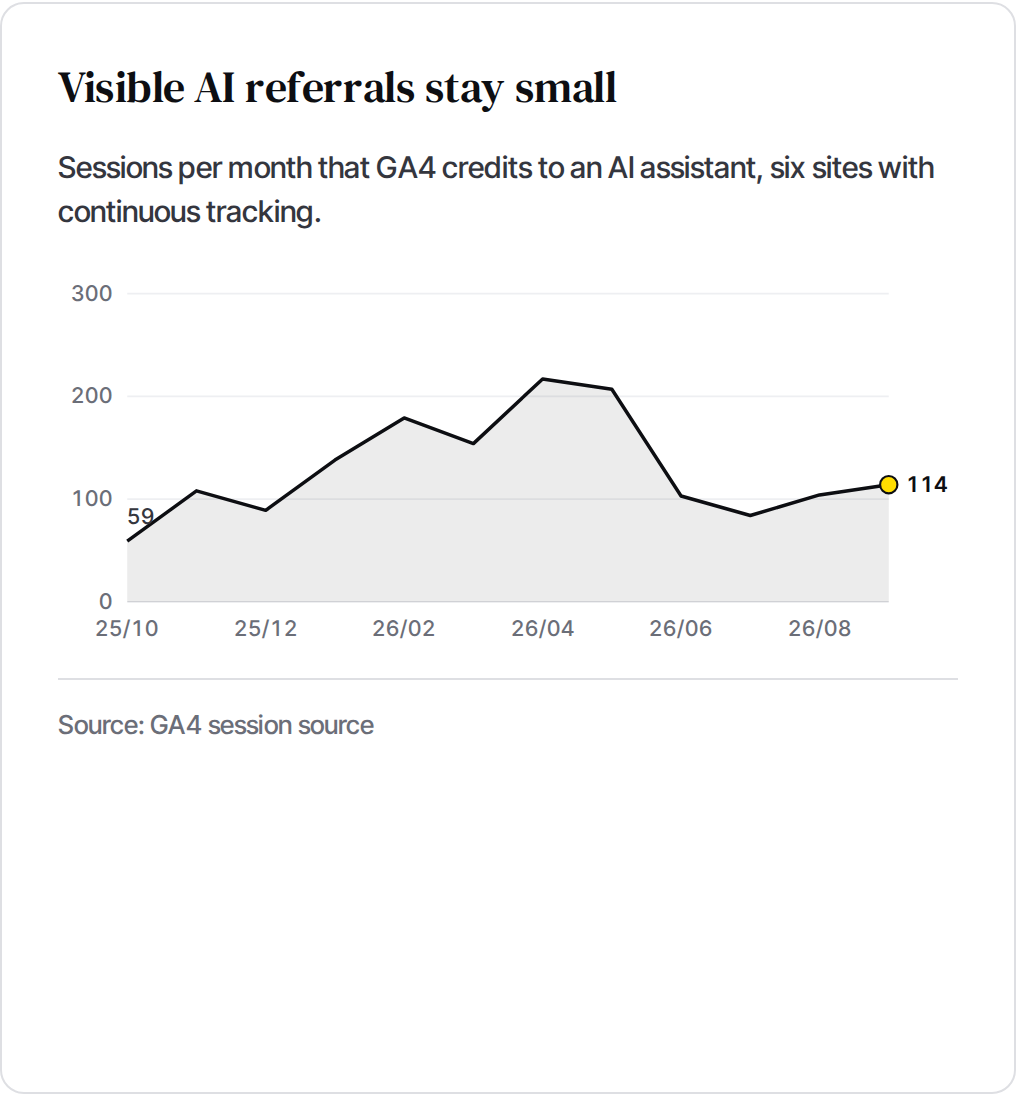
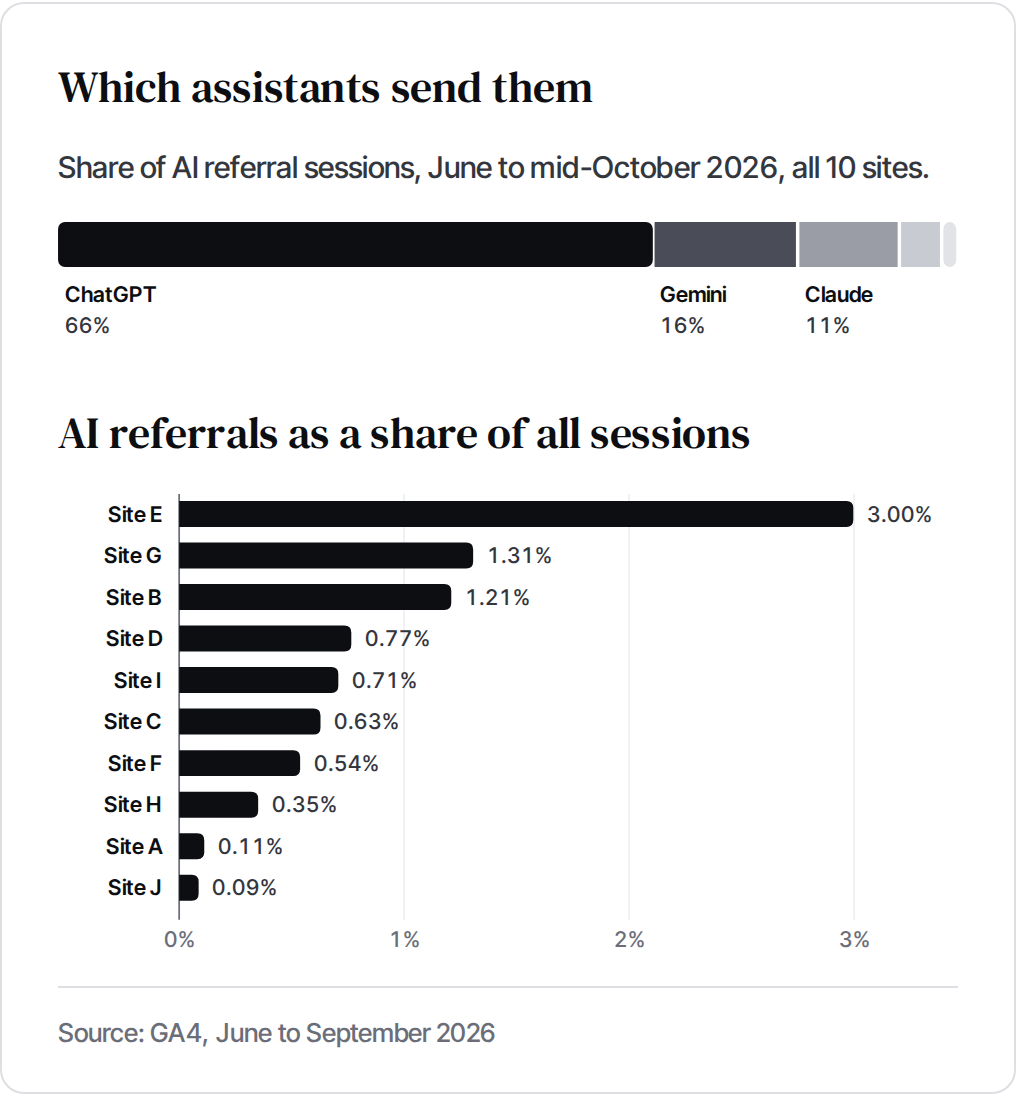
The AI traffic that is visible is small. It ranges from 0.09% to 3.0% of sessions per site, and ChatGPT sends 66% of it.
Deep-page Direct doesn't behave like AI visitors
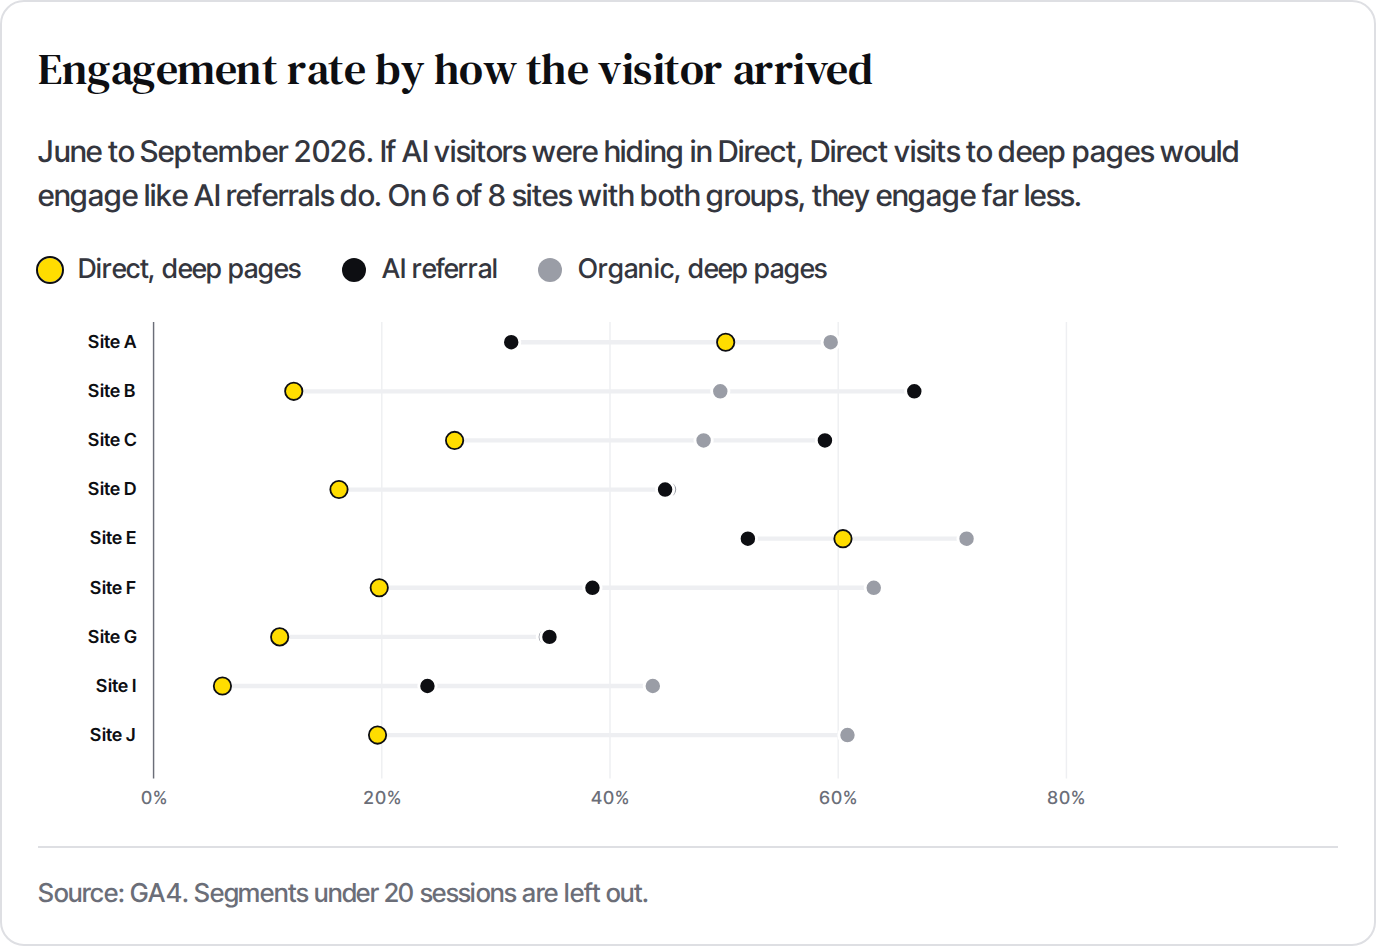
Ramp's argument rests on behaviour: Direct visits to deep pages acted like search visitors, so they were probably people sent by AI. We ran the same comparison. On 6 of 8 sites, Direct visits to deep pages engaged far less often than AI referrals or organic visitors. They look like bots, previews and link checkers, not people.
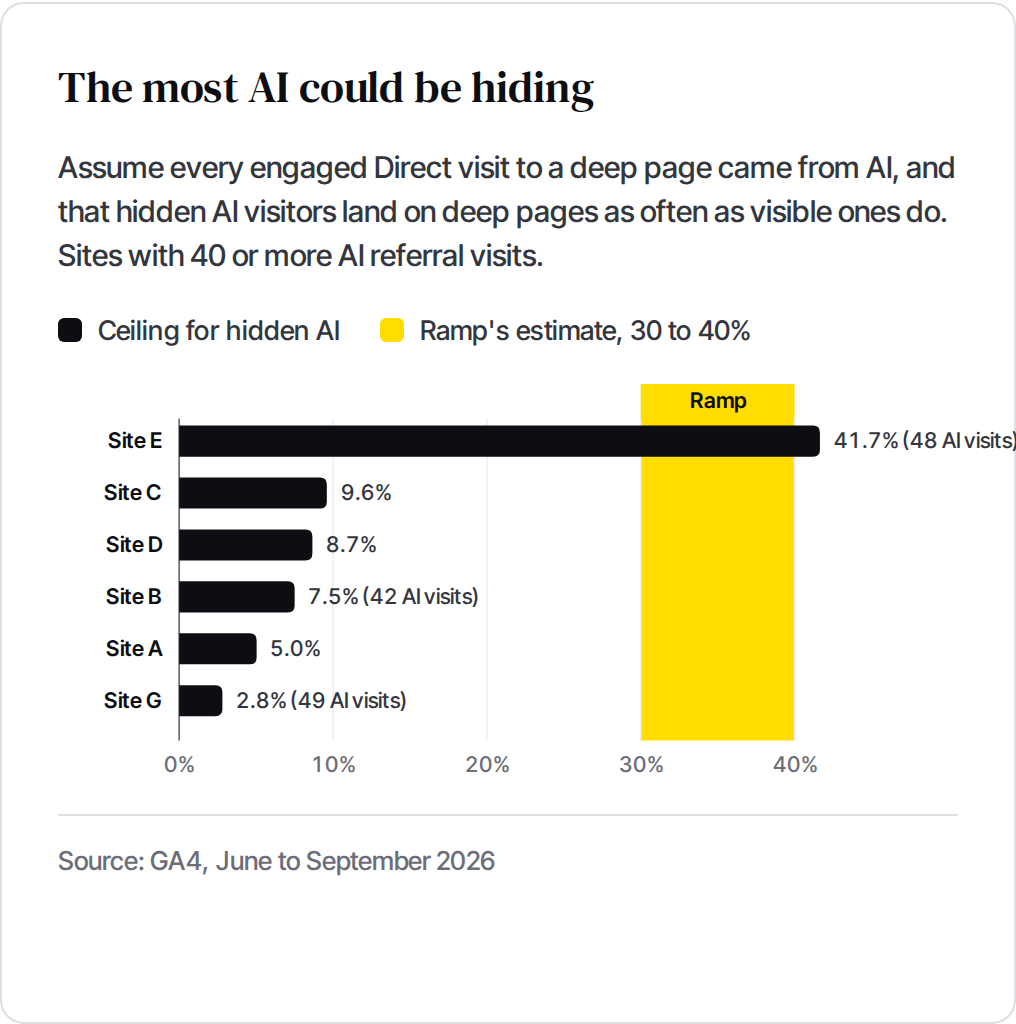
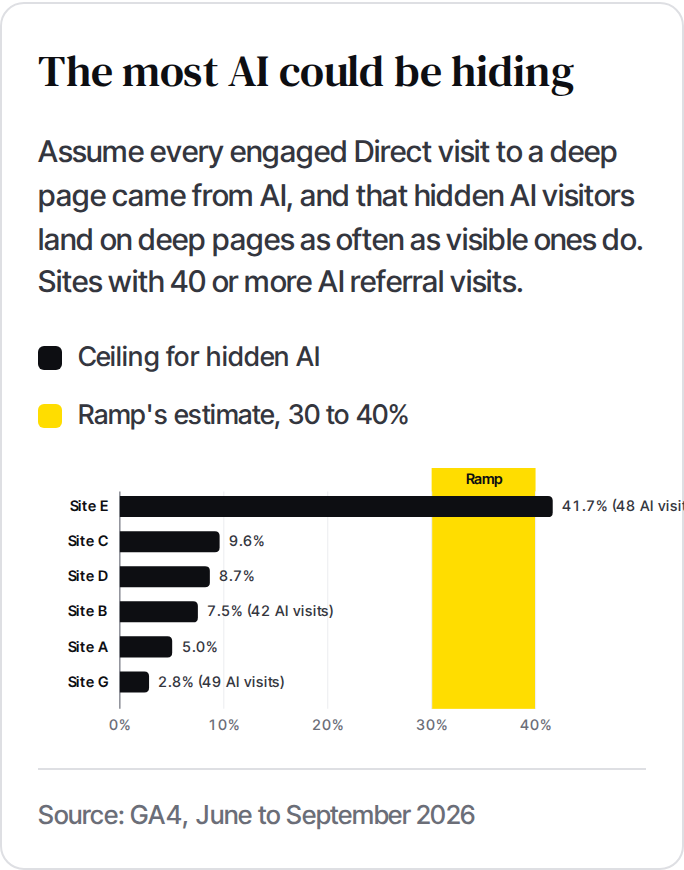
Then we gave the hidden-AI idea every benefit of the doubt. Assume every engaged Direct visit to a deep page came from AI. Visible AI visitors only land on deep pages part of the time (4% to 82% of visits, depending on the site), so we scaled up for the hidden ones that would land elsewhere. Even then, hidden AI comes to 6.3% of all Direct traffic across the 6 sites with enough AI visits to scale. Ramp's figure is 30 to 40%.
One small site breaks the pattern. Site E's ceiling reaches 42%, because only 13% of its 48 AI visits landed on deep pages. With so few visits the scaling is fragile, but on that site the data can't rule Ramp's range out.
Device mix didn't separate them either. ChatGPT's apps can drop the referrer, which would push hidden AI toward phones. Instead, deep-page Direct was mostly desktop, as AI referrals were.
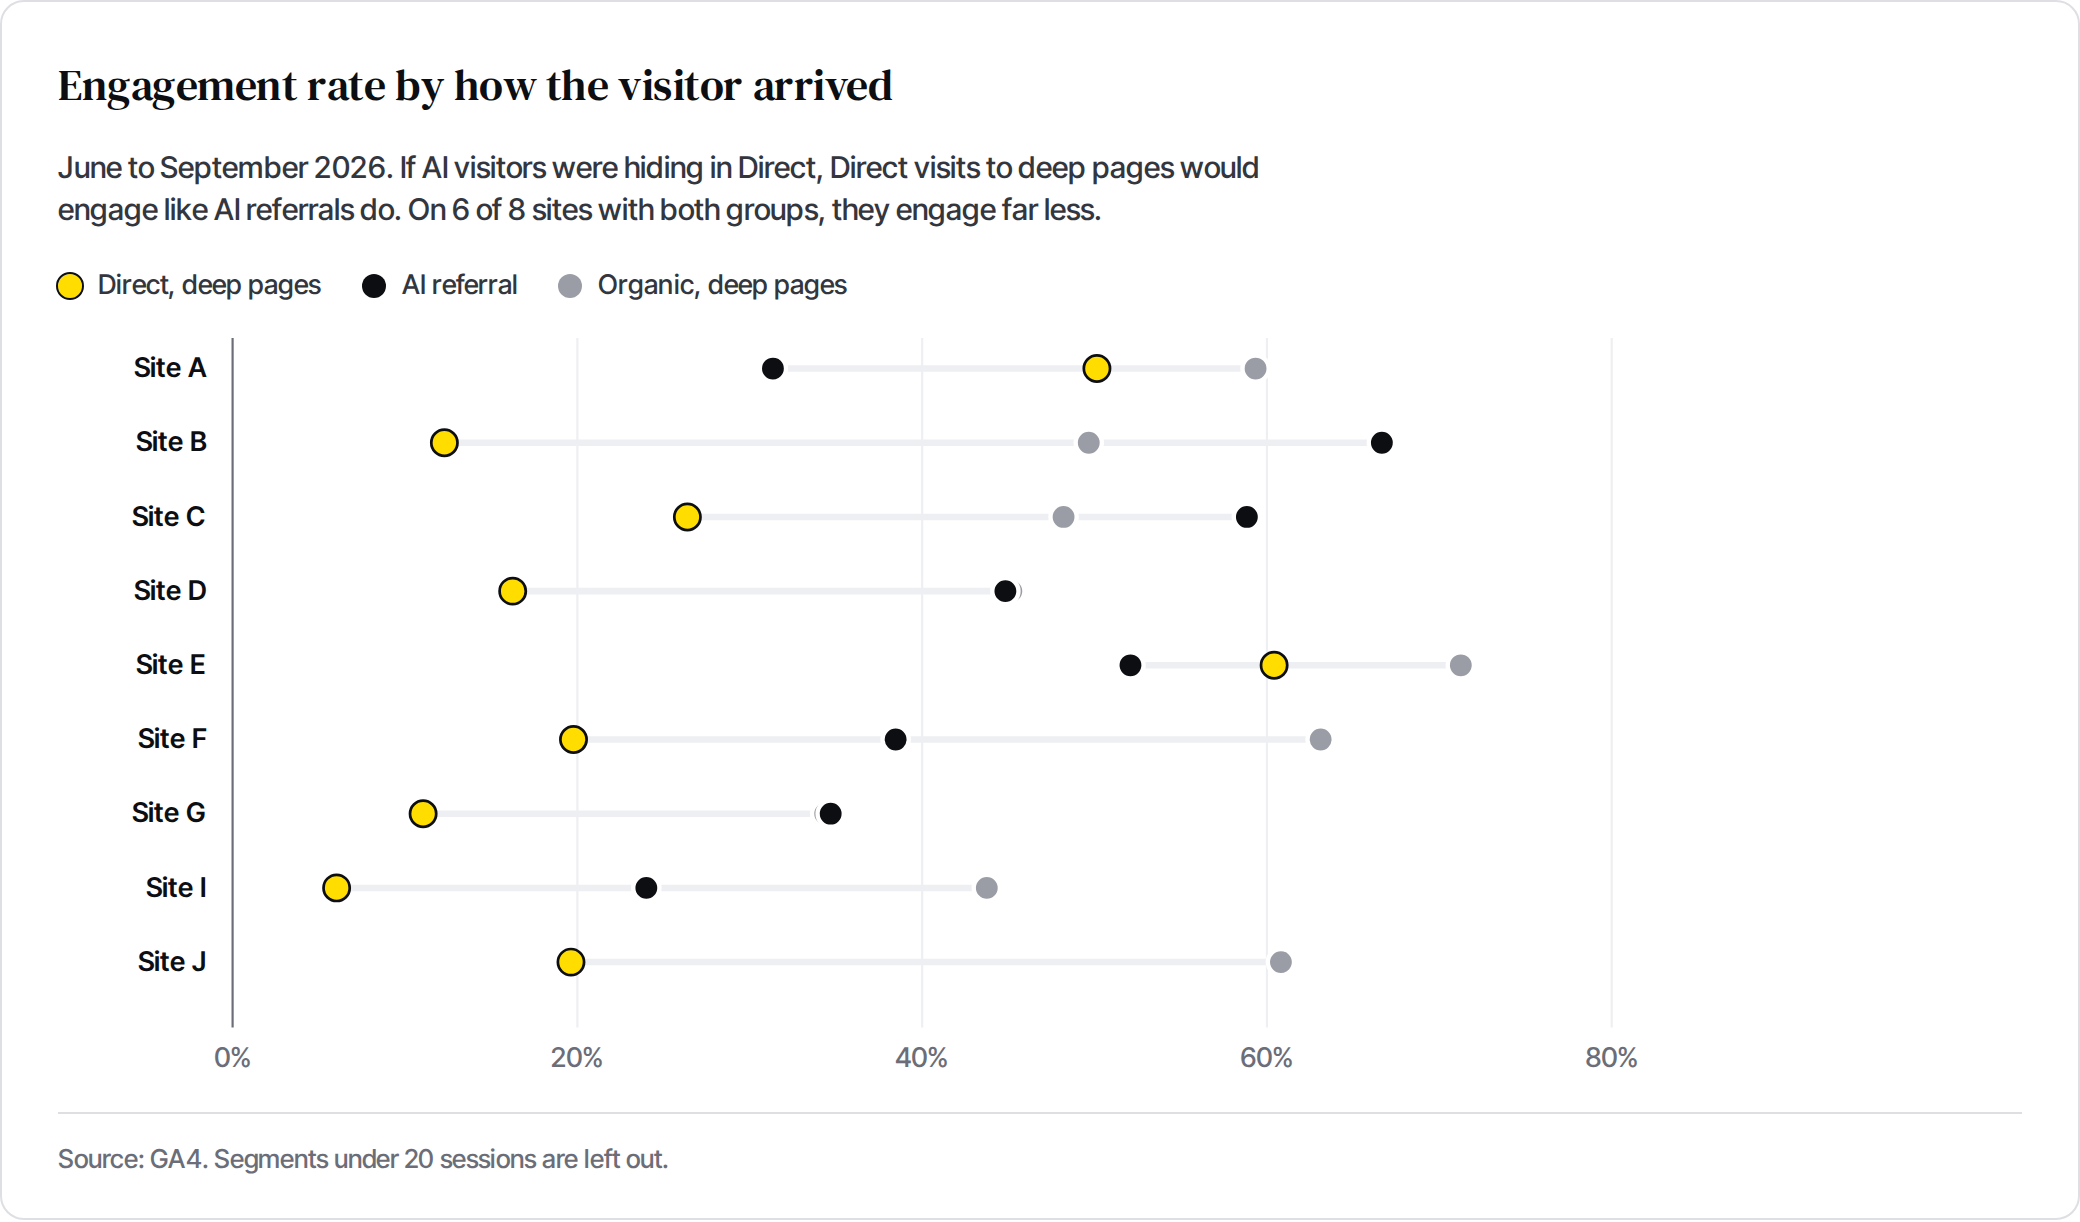
Show the table
| Site | Direct deep: sessions | engaged | AI referral: sessions | engaged | Organic deep: sessions | engaged |
|---|---|---|---|---|---|---|
| Site A | 363 | 50% | 134 | 31% | 91 | 59% |
| Site B | 407 | 12% | 42 | 67% | 149 | 50% |
| Site C | 2,896 | 26% | 481 | 59% | 2,448 | 48% |
| Site D | 2,431 | 16% | 145 | 45% | 7,199 | 45% |
| Site E | 48 | 60% | 48 | 52% | 313 | 71% |
| Site F | 713 | 20% | 26 | 38% | 244 | 63% |
| Site G | 561 | 11% | 49 | 35% | 160 | 34% |
| Site H | – | – | – | – | – | – |
| Site I | 348 | 6% | 25 | 24% | 48 | 44% |
| Site J | 377 | 20% | – | – | 74 | 61% |
Strong correlations, mostly shared trends
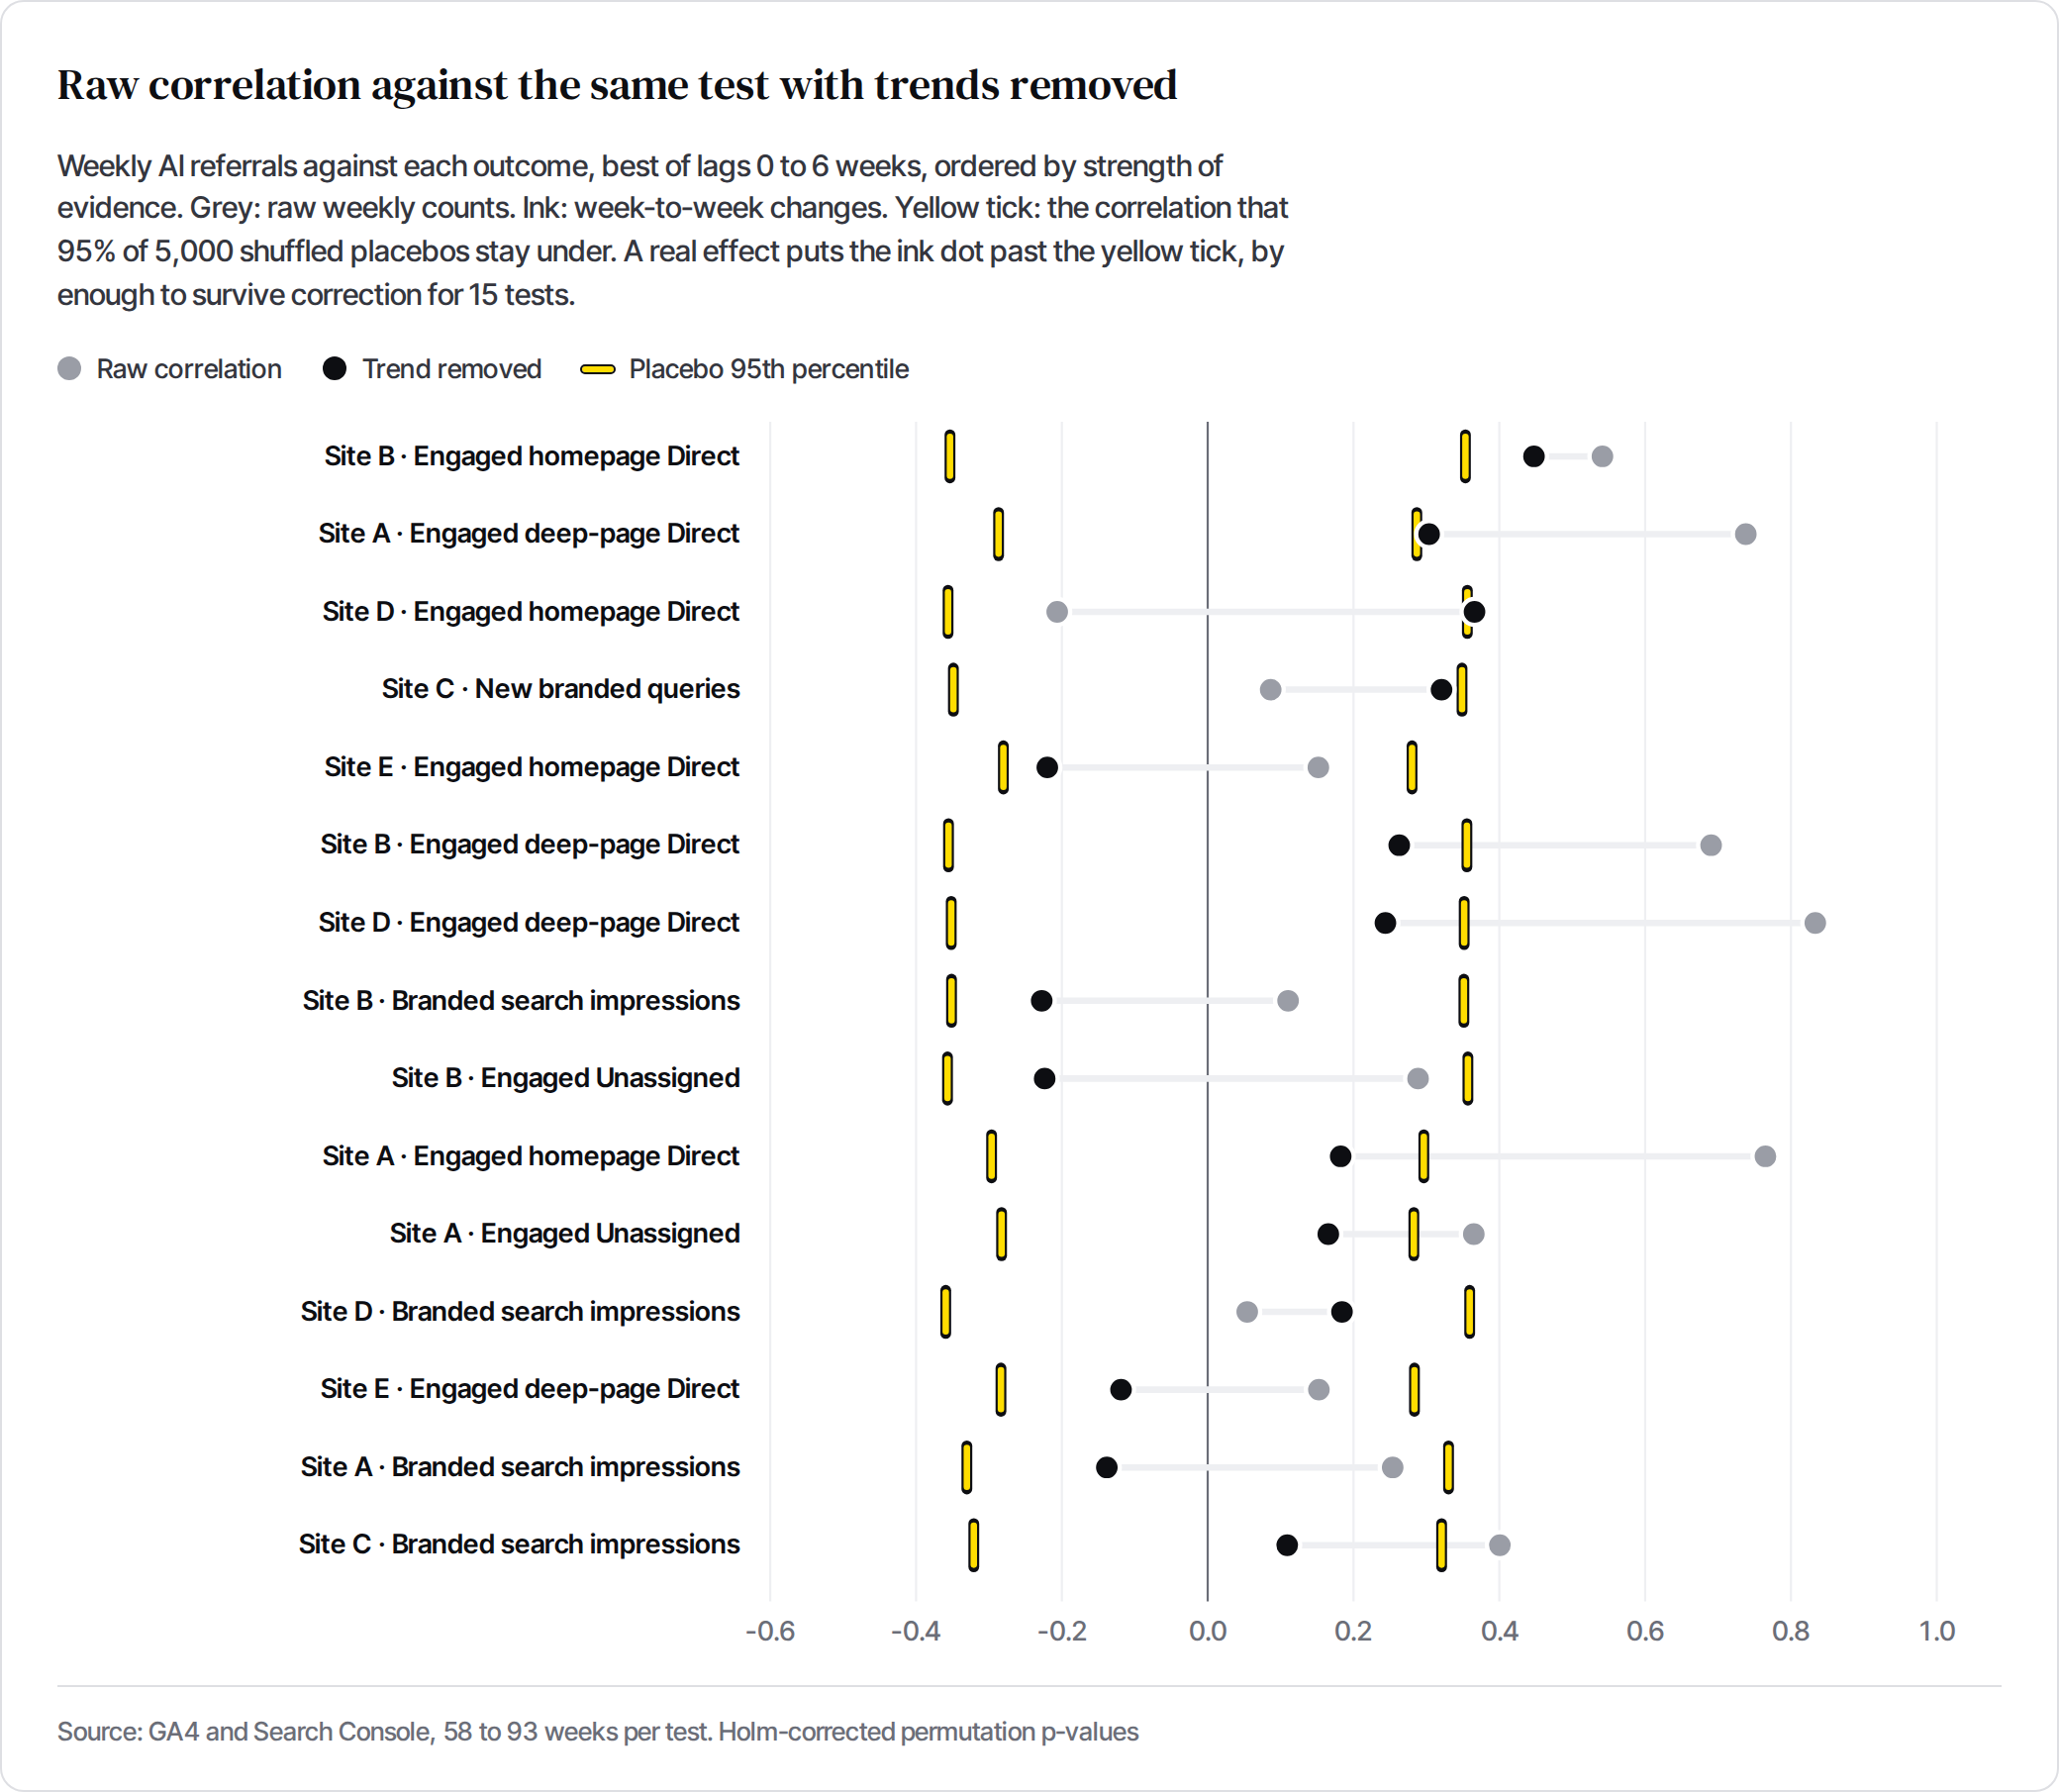
We lined up weekly AI referrals against five outcomes: engaged Direct visits to deep pages, engaged Direct visits to the homepage, engaged sessions GA4 couldn't assign to any channel, branded search impressions, and new branded queries. That made 15 tests across 5 sites, with 58 to 93 weeks each.
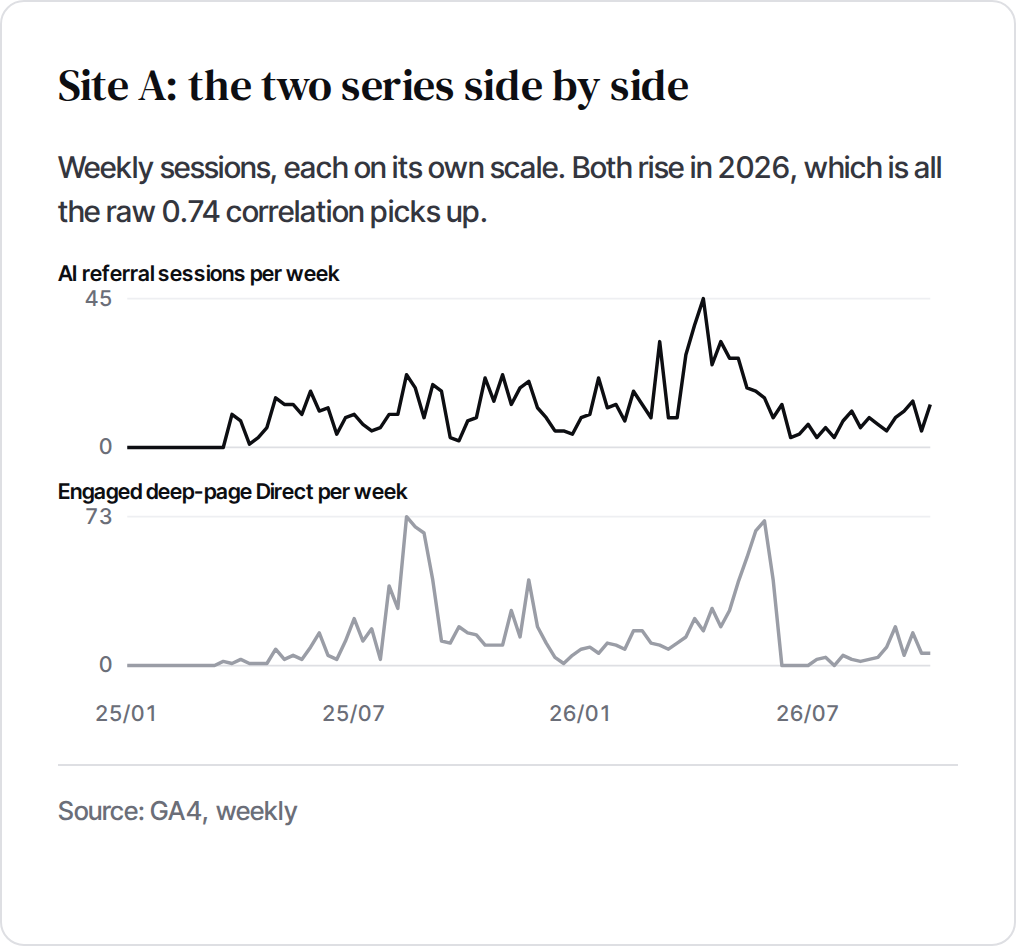
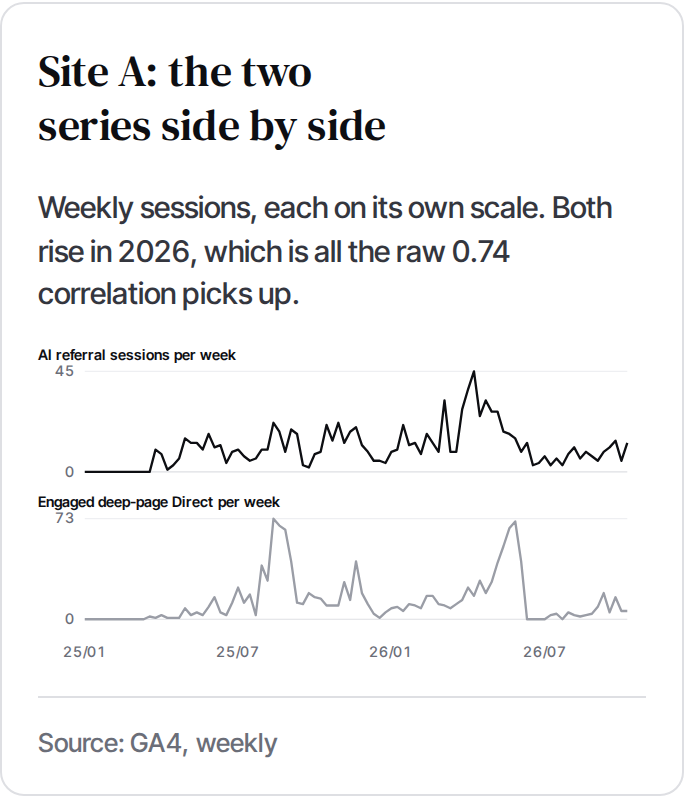
On raw weekly counts the picture looks compelling: correlations up to 0.83. That is the trap Kevin described. Every series grew through 2026, so any two of them correlate. Once we compared week-to-week changes, none of the 15 links survived correction for testing 15 at once. Site A's deep-page Direct, at 0.74 raw, fell to 0.30.
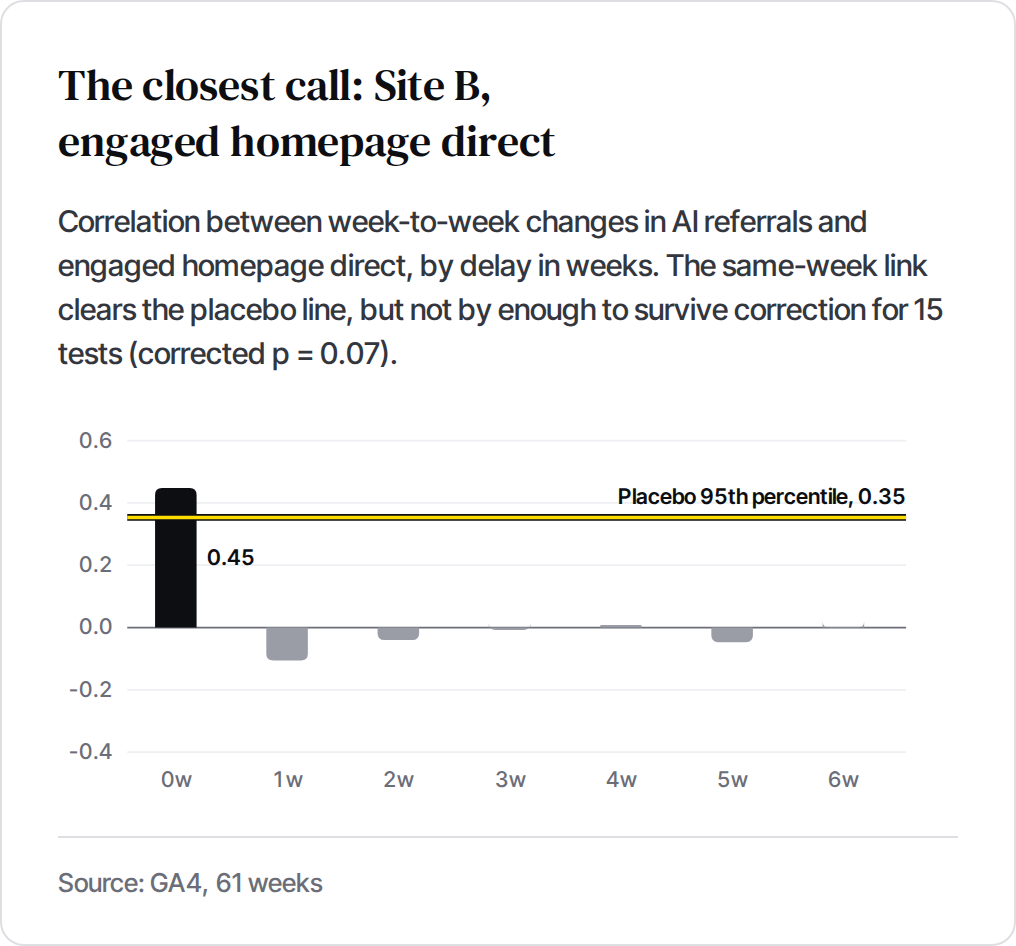
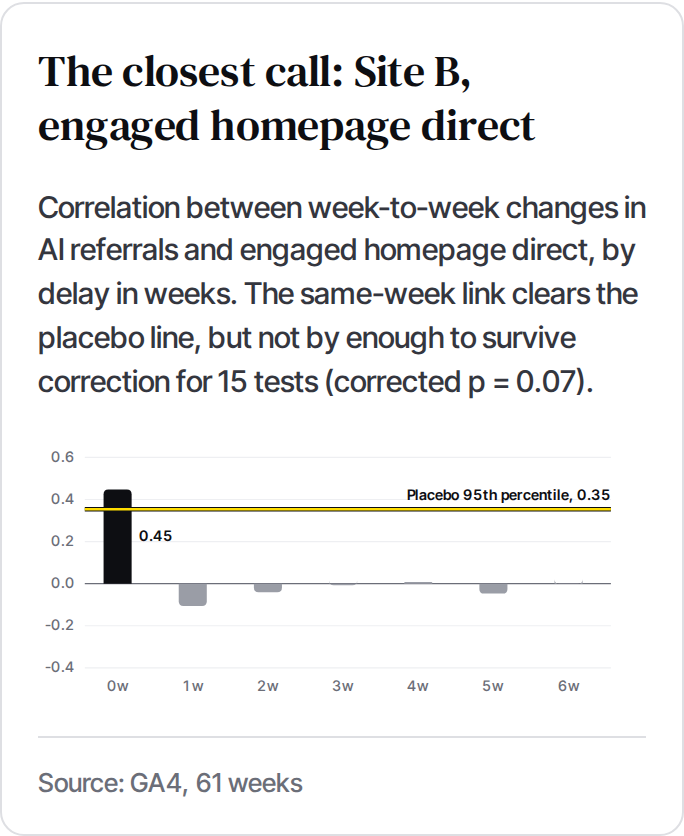
One result is worth watching. On Site B, engaged homepage Direct rose and fell with AI referrals in the same week (r = 0.45), in both halves of the timeline, and the link held after controlling for organic, email, referral and social traffic. It misses the corrected threshold (p = 0.07), rests on about five AI visits a week, and moves in the same week rather than later, which fits a shared cause such as a campaign as well as it fits AI. The homepage is where an AI-influenced visitor who types the brand would land, so it's the place to keep measuring.
These tests could reliably detect a correlation of about 0.3 or more. A weaker effect could still exist.
Show the table
| Test | Weeks | Raw r | Trend removed r | Lag (weeks) | Placebo 95th | p | Corrected p | First half | Second half | Detectable r |
|---|---|---|---|---|---|---|---|---|---|---|
| Site B · Engaged homepage Direct | 61 | 0.54 | 0.45 | 0 | 0.35 | 0.004 | 0.07 | 0.50 | 0.42 | 0.35 |
| Site A · Engaged deep-page Direct | 93 | 0.74 | 0.30 | 5 | 0.29 | 0.033 | 0.47 | 0.42 | 0.19 | 0.30 |
| Site D · Engaged homepage Direct | 61 | -0.21 | 0.37 | 0 | 0.36 | 0.042 | 0.55 | 0.52 | 0.06 | 0.35 |
| Site C · New branded queries | 61 | 0.09 | 0.32 | 6 | 0.35 | 0.096 | 1.00 | 0.41 | 0.27 | 0.37 |
| Site E · Engaged homepage Direct | 93 | 0.15 | -0.22 | 1 | 0.28 | 0.219 | 1.00 | -0.28 | -0.18 | 0.29 |
| Site B · Engaged deep-page Direct | 61 | 0.69 | 0.26 | 0 | 0.36 | 0.295 | 1.00 | 0.40 | 0.14 | 0.35 |
| Site D · Engaged deep-page Direct | 61 | 0.83 | 0.24 | 0 | 0.35 | 0.363 | 1.00 | 0.27 | 0.15 | 0.35 |
| Site B · Branded search impressions | 61 | 0.11 | -0.23 | 5 | 0.35 | 0.424 | 1.00 | -0.17 | -0.27 | 0.37 |
| Site B · Engaged Unassigned | 61 | 0.29 | -0.22 | 3 | 0.36 | 0.454 | 1.00 | -0.19 | -0.27 | 0.36 |
| Site A · Engaged homepage Direct | 93 | 0.77 | 0.18 | 4 | 0.30 | 0.486 | 1.00 | -0.06 | 0.37 | 0.29 |
| Site A · Engaged Unassigned | 93 | 0.36 | 0.17 | 2 | 0.28 | 0.551 | 1.00 | 0.16 | 0.17 | 0.29 |
| Site D · Branded search impressions | 58 | 0.05 | 0.18 | 0 | 0.36 | 0.708 | 1.00 | 0.36 | 0.01 | 0.36 |
| Site E · Engaged deep-page Direct | 93 | 0.15 | -0.12 | 2 | 0.28 | 0.847 | 1.00 | -0.03 | -0.24 | 0.29 |
| Site A · Branded search impressions | 68 | 0.25 | -0.14 | 4 | 0.33 | 0.891 | 1.00 | -0.13 | -0.16 | 0.35 |
| Site C · Branded search impressions | 68 | 0.40 | 0.11 | 0 | 0.32 | 0.968 | 1.00 | 0.21 | 0.08 | 0.34 |
Cited pages get more AI clicks, not more Direct
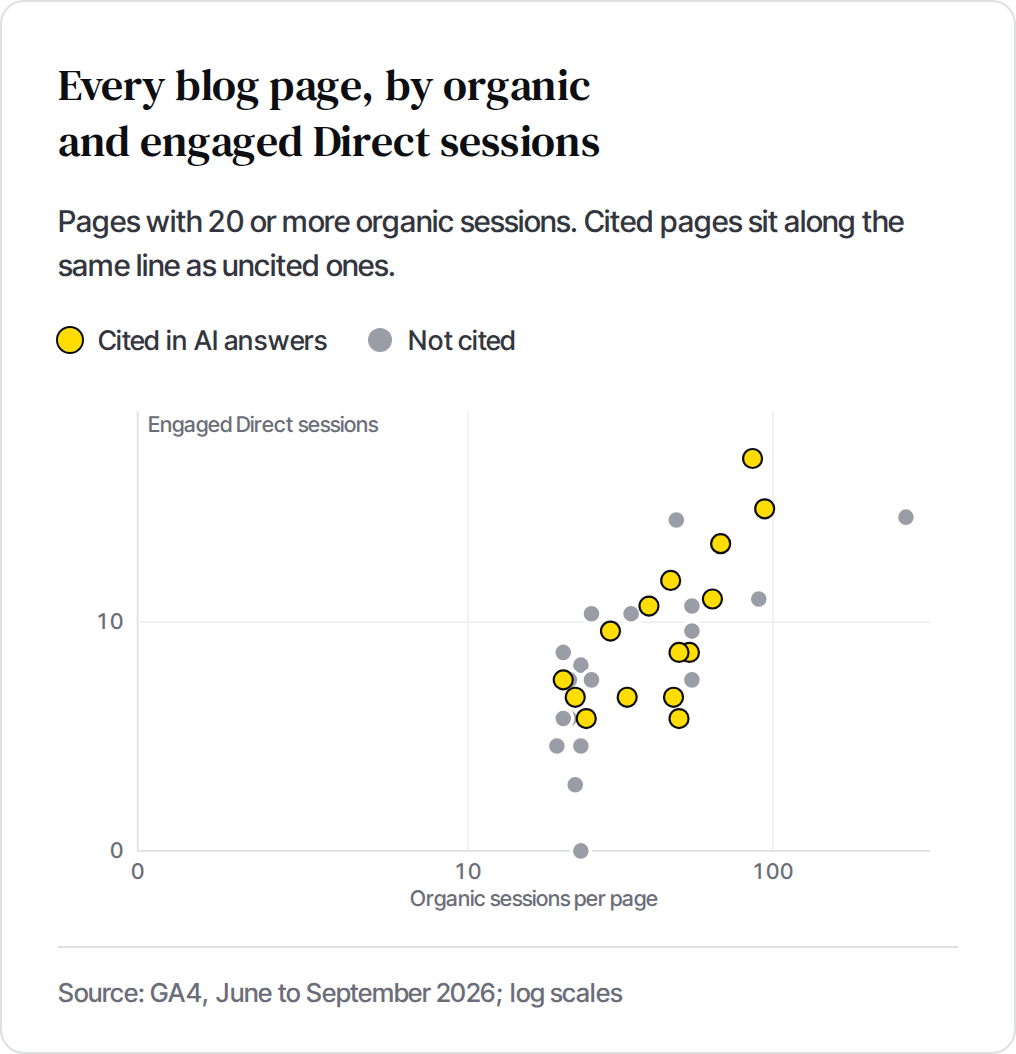
For Site C we had AI answer runs from September listing every page each engine cited. Of the 33 blog pages with enough organic traffic to compare, 15 were cited.
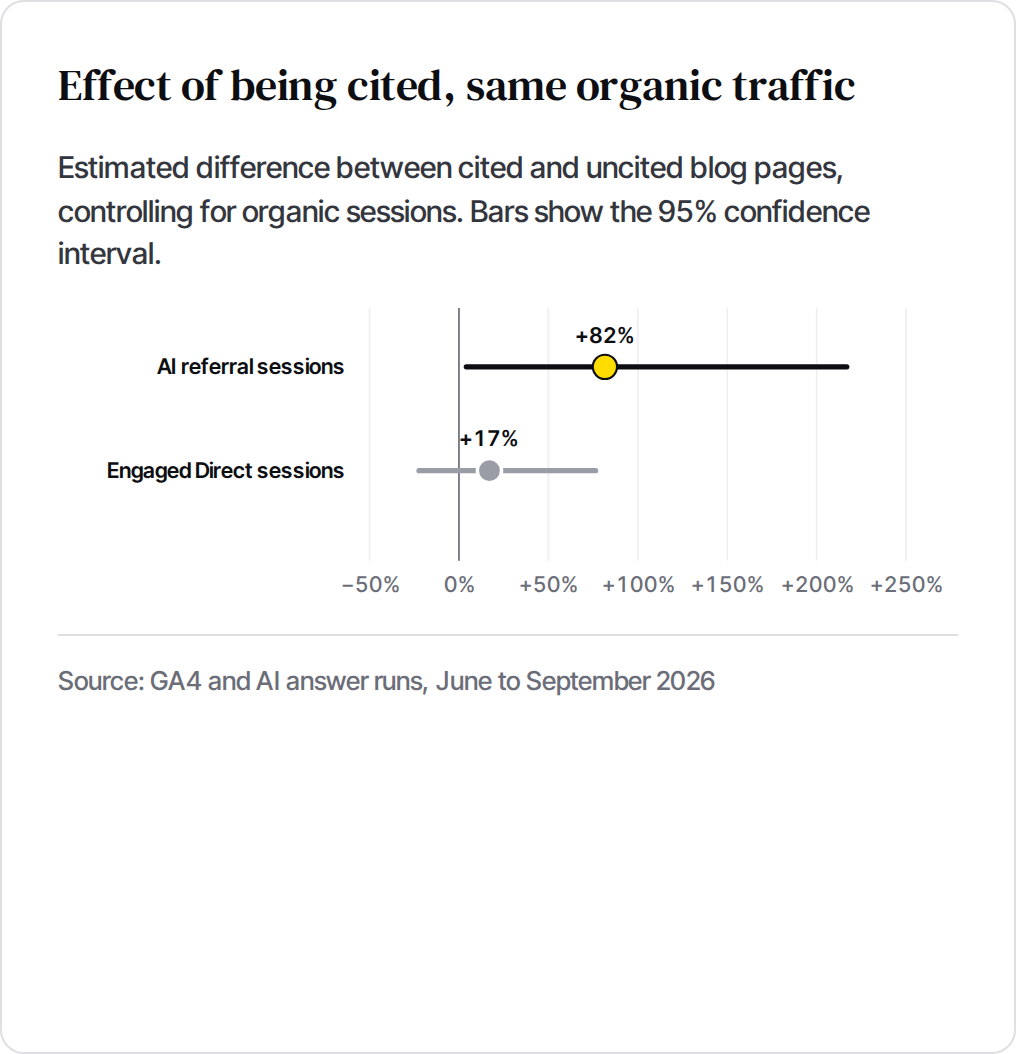
Holding organic traffic constant, cited pages received +82% more AI referral sessions (95% interval +4% to +217%). Citations do send clicks, and GA4 sees them. Engaged Direct on the same pages was +17% higher, with an interval running from −22% to +76%, so no detectable difference. If citations pushed people into Direct, this is where it would show.